- December 21, 2020
- Posted by: JPM 4 Marketing
- Categories: Digital Marketing, Legal Marketing, Marketing Analytics, Marketing ROI

If you are using various marketing sources to attract clients but you really don’t know which sources are generating your best return on investment, you’re not alone! Many businesses “feel” that their clientele has increased or they are seeing more revenues, but they usually cannot tell you why or where their business is coming from, or how they can improve their Return on Ad Spend (ROAS).
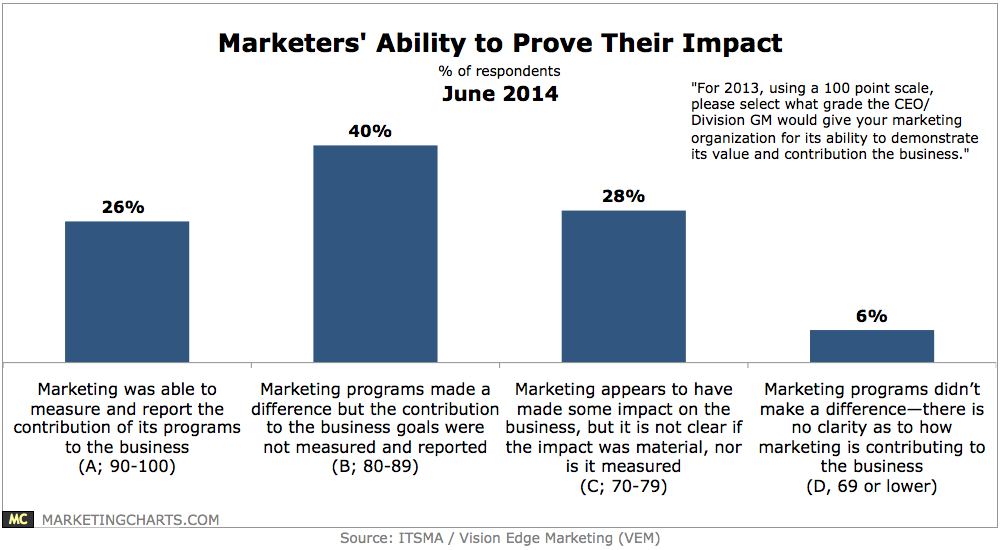
According to ITSMA and Vision Edge Marketing, 74% of marketers can’t measure or report how their efforts impact their business. Tracking Your Marketing Efforts: Why It’s Important And How To Start This lack of insight by business can largely be attributed to an absence of data being provided to them by their marketing professionals.
Marketing data and analytics are critical to ensuring that your money is being spent in the right places for your marketing campaign. A high quality marketing agency will meticulously track data and report it to you on a consistent basis. Without this type of analysis and reporting you are blind marketing, and most certainly wasting part of your marketing budget.
Comprehensive, consistent reporting from your marketing agency should be able to tell you several things including:
- How many people visited my website from this ad?
- How long did people stay on my website that clicked from this ad?
- What day(s) of the week have the greatest amount of traffic from this ad?
- What time(s) of the day have the greatest amount of traffic from this ad?
- How long does the average person from this ad spend on my website?
- How many people from this campaign requested information?
This data will help you focus on the best areas to spend your marketing dollars to achieve the highest Return on Ad Spend (ROAS).
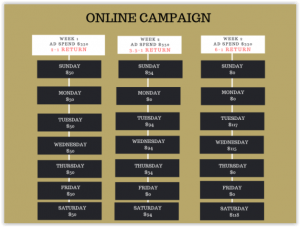
As an example, if your daily spend budget is $50 and your weekly budget is $350 (see Week 1 below) and your report data shows that you received 80 new website visitors over the past 7 days (Sunday – Saturday) but that 62 of those visitors were on Tuesday, Wednesday and Saturday. This is a good indication that you may want to use 80% of your weekly budget on those 3 days. So instead of $50 a day and $350 a week, your ad spend would be adjusted to reflect this trend (see Week 2 below). By the end of Week 2 the data shows the trend continues with a vast majority of ad clicks occurring on Tuesday, Wednesday and Saturday, so you adjust your weekly ad budget to spend 100% on Tuesday, Wednesday and Saturday (see Week 3 below).
Through clear, concise marketing reports you can dramatically improve your Return on Ad Spend without increasing your marketing budget. This is the power of using a marketing agency that tracks and reports marketing data for your marketing campaigns.
In digital marketing, the devil really is in the data details!